PIPER: Difference between revisions
From Modelado Foundation
imported>Schulzm |
No edit summary |
||
| (11 intermediate revisions by 2 users not shown) | |||
| Line 5: | Line 5: | ||
| website = | | website = | ||
| team-members = LLNL, PNNL, Rice Uni., U. of Maryland, U. of Utah, U. of Wisconsin | | team-members = LLNL, PNNL, Rice Uni., U. of Maryland, U. of Utah, U. of Wisconsin | ||
| pi = Martin Schulz | | pi = [[Martin Schulz]] | ||
| co-pi = Peer-Timo Bremer, Todd Gamblin, Jeff Hollingsworth, John Mellor-Crummey, Barton Miller, Valerio Pascucci, Nathan Tallent}} | | co-pi = Peer-Timo Bremer, Todd Gamblin, Jeff Hollingsworth, John Mellor-Crummey, Barton Miller, Valerio Pascucci, Nathan Tallent}} | ||
The PIPER (Performance Insight for Programmers and Exascale Runtimes) project is developing new techniques for measuring, analyzing, attributing, and presenting performance data on exascale systems. | |||
== Team Members == | == Team Members == | ||
| Line 24: | Line 24: | ||
To provide this essential functionality for the extreme-scale software stack, we are developing new abstractions, techniques, and novel tools for data measurement, analysis, attribution, diagnostic feedback, and visualization. This enables Performance Insights for Programmers and Exascale Runtimes (PIPER). This project cuts across the entire software stack by collecting data in all system components through novel abstractions and integrated introspection, providing data attribution and analysis in a system-wide context and across programming models, enabling global correlations of performance data from independent sources in different domains, and delivering dynamic feedback to run-time systems and applications through auto-tuning as well as interactive visualizations. | To provide this essential functionality for the extreme-scale software stack, we are developing new abstractions, techniques, and novel tools for data measurement, analysis, attribution, diagnostic feedback, and visualization. This enables Performance Insights for Programmers and Exascale Runtimes (PIPER). This project cuts across the entire software stack by collecting data in all system components through novel abstractions and integrated introspection, providing data attribution and analysis in a system-wide context and across programming models, enabling global correlations of performance data from independent sources in different domains, and delivering dynamic feedback to run-time systems and applications through auto-tuning as well as interactive visualizations. | ||
== Project Impact == | |||
== | * [https://xstackwiki.modelado.org/images/b/b8/PIPER-Impact_summary.pdf PIPER Project Impact] | ||
== Approach == | |||
PIPER consists of four thrust areas, organized into three phases. | PIPER consists of four thrust areas, organized into three phases. | ||
| Line 32: | Line 35: | ||
[[File:columns.png]] | [[File:columns.png]] | ||
* Thrust 1: | * Thrust 1: We design and implement a series of new scalable measurement techniques to pinpoint and quantify the main roadblocks on the way to exascale, including lack of parallelism, energy consumption, and load imbalance. | ||
* Thrust 2: We | * Thrust 2: We combine a broad range of stack-wide metrics and measurements to gain a global picture of the application's execution running on top of the highly complex and possibly adaptive exascale system architecture. | ||
* Thrust 3: We | * Thrust 3: We exploit the stack-wide correlated data and develop a suite of new feature-based analysis and visualization techniques that allow us to gain true insight into a code's behavior and relay this information back to the user in an intuitive fashion | ||
* Thrust 4: We apply the analysis results to enable feedback into the system stack enabling autonomic optimization loops both for high- and low-level adaptations. | * Thrust 4: We apply the analysis results to enable feedback into the system stack enabling autonomic optimization loops both for high- and low-level adaptations. | ||
| Line 44: | Line 47: | ||
== Architecture and Interaction with the Software Stack == | == Architecture and Interaction with the Software Stack == | ||
We | We implement our research in a set of modular components that can be deployed | ||
across various execution and programming models, covering both legacy (MPI+X) models and new models developed in other X-Stack2 projects. Wherever possible, we | across various execution and programming models, covering both legacy (MPI+X) models and new models developed in other X-Stack2 projects. Wherever possible, we leverage the extensive | ||
tool infrastructures available through prior work in our project team and integrate | tool infrastructures available through prior work in our project team and integrate | ||
the results of our research back into these existing production-level tool sets. | the results of our research back into these existing production-level tool sets. | ||
Furthermore, we | Furthermore, we make the results of our research available to a broad audience | ||
and work with the larger tools community to achieve a wider adaption. | and work with the larger tools community to achieve a wider adaption. | ||
The figure below provides an initial high-level sketch of our envisioned architecture | The figure below provides an initial high-level sketch of our envisioned architecture | ||
that will provide the PIPER functionality: | that will provide the PIPER functionality: | ||
[[File: | [[File:Piper_architecture.png]] | ||
We | We target measurements from the entire hardware/software stack. That is, | ||
we expect to use measurements from both the underlying system hardware as well | we expect to use measurements from both the underlying system hardware as well | ||
as custom measurements derived from the application. The measurements themselves | as custom measurements derived from the application. The measurements themselves | ||
leverage a series of adaptive instrumentation techniques. As part of the | |||
measurement operation, we | measurement operation, we associate the measurements with a local | ||
call stack. The correlated local stack/performance measurement data | call stack. The correlated local stack/performance measurement data feeds | ||
an analysis pipeline consisting of both node-local analysis methods, and | an analysis pipeline consisting of both node-local analysis methods, and | ||
distributed, wider-context analysis methods. | distributed, wider-context analysis methods. | ||
The resulting data | The resulting data | ||
store | store supports a high-level query interface used by visualization and data | ||
analysis reporting tools informing the user. Such a system also enables dynamic tuning, | analysis reporting tools informing the user. Such a system also enables dynamic tuning, | ||
and feedback-directed optimization. | and feedback-directed optimization. | ||
== Released Software == | |||
=== Infrastructure Elements === | |||
* [http://www.paradyn.org/html/dyninst9.0.3-features.html Dyninst 9.0 - Dynamic Instrumentation Library] | |||
* [http://www.paradyn.org/html/mrnet5.0.0-features.html MRNet 5.0 - Tree-based Overlay Network] | |||
* [https://github.com/OpenMPToolsInterface OMPT/OMPD - Tool Interfaces for OpenMP] | |||
=== Bottleneck Detection / Analysis === | |||
* [http://hpctoolkit.org/ HPCToolkit - Sampling centric analysis and blame shifting] | |||
=== Performance Visualization === | |||
* [https://computation.llnl.gov/project/performance-analysis-through-visualization/software.php Boxfish - Visual performance analysis through data centric mappings] | |||
* [https://github.com/scalability-llnl/ravel Ravel - MPI trace visualization using logical timelines] | |||
* [https://github.com/scalability-llnl/MemAxes MemAxes/Mitos - Visualization of on-node memory traffic] | |||
=== Auto-Tuning === | |||
* [http://www.dyninst.org/harmony Active Harmony 4.5 - Multiparameter Tuning Systme] | |||
Latest revision as of 05:03, July 10, 2023
| PIPER: Performance Insight for Programmers and Exascale Runtimes | |
|---|---|
 | |
| Team Members | LLNL, PNNL, Rice Uni., U. of Maryland, U. of Utah, U. of Wisconsin |
| PI | Martin Schulz |
| Co-PIs | Peer-Timo Bremer, Todd Gamblin, Jeff Hollingsworth, John Mellor-Crummey, Barton Miller, Valerio Pascucci, Nathan Tallent |
| Website | |
| Download | {{{download}}} |
The PIPER (Performance Insight for Programmers and Exascale Runtimes) project is developing new techniques for measuring, analyzing, attributing, and presenting performance data on exascale systems.
Team Members
- Lawrence Livermore National Laboratory (team pages)
- Pacific Northwest National Laboratory (team pages)
- Rice University (team pages)
- University of Maryland (team pages)
- University of Utah (team pages)
- University of Wisconsin (team pages)
Objectives
Exascale architectures and applications will be much more complex than today's systems, and to achieve high performance, radical changes will be required in high performance computing (HPC) applications and in the system software stack. In such a variable environment, performance tools are essential to enable users to optimize application and system code. Tools must provide online performance feedback to runtime systems to guide online adaptation, and they must output intuitive summaries and visualizations to help developers identify performance problems.
To provide this essential functionality for the extreme-scale software stack, we are developing new abstractions, techniques, and novel tools for data measurement, analysis, attribution, diagnostic feedback, and visualization. This enables Performance Insights for Programmers and Exascale Runtimes (PIPER). This project cuts across the entire software stack by collecting data in all system components through novel abstractions and integrated introspection, providing data attribution and analysis in a system-wide context and across programming models, enabling global correlations of performance data from independent sources in different domains, and delivering dynamic feedback to run-time systems and applications through auto-tuning as well as interactive visualizations.
Project Impact
Approach
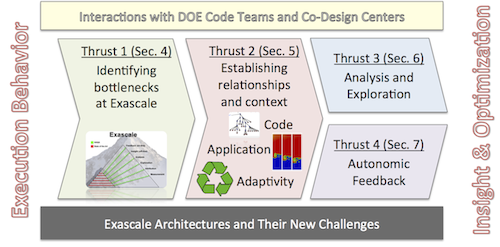
PIPER consists of four thrust areas, organized into three phases. The following figure gives an overall view of our approach:
- Thrust 1: We design and implement a series of new scalable measurement techniques to pinpoint and quantify the main roadblocks on the way to exascale, including lack of parallelism, energy consumption, and load imbalance.
- Thrust 2: We combine a broad range of stack-wide metrics and measurements to gain a global picture of the application's execution running on top of the highly complex and possibly adaptive exascale system architecture.
- Thrust 3: We exploit the stack-wide correlated data and develop a suite of new feature-based analysis and visualization techniques that allow us to gain true insight into a code's behavior and relay this information back to the user in an intuitive fashion
- Thrust 4: We apply the analysis results to enable feedback into the system stack enabling autonomic optimization loops both for high- and low-level adaptations.
We are implementing our research in a set of modular components that can be deployed across various execution and programming models. Wherever possible, we leverage the extensive tool infrastructures available through prior work in our project team and integrate the results of our research back into these existing production-level tool sets.
Architecture and Interaction with the Software Stack
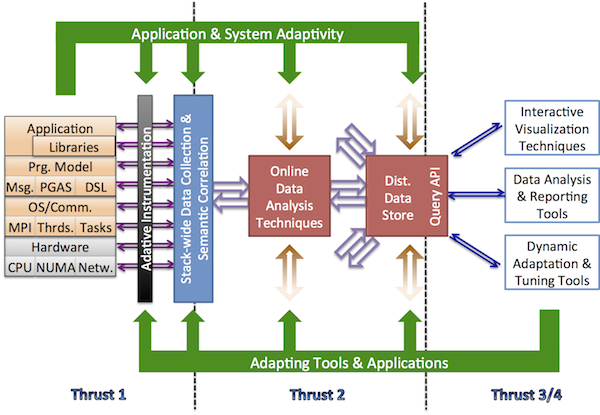
We implement our research in a set of modular components that can be deployed across various execution and programming models, covering both legacy (MPI+X) models and new models developed in other X-Stack2 projects. Wherever possible, we leverage the extensive tool infrastructures available through prior work in our project team and integrate the results of our research back into these existing production-level tool sets. Furthermore, we make the results of our research available to a broad audience and work with the larger tools community to achieve a wider adaption. The figure below provides an initial high-level sketch of our envisioned architecture that will provide the PIPER functionality:
We target measurements from the entire hardware/software stack. That is, we expect to use measurements from both the underlying system hardware as well as custom measurements derived from the application. The measurements themselves leverage a series of adaptive instrumentation techniques. As part of the measurement operation, we associate the measurements with a local call stack. The correlated local stack/performance measurement data feeds an analysis pipeline consisting of both node-local analysis methods, and distributed, wider-context analysis methods. The resulting data store supports a high-level query interface used by visualization and data analysis reporting tools informing the user. Such a system also enables dynamic tuning, and feedback-directed optimization.
Released Software
Infrastructure Elements
- Dyninst 9.0 - Dynamic Instrumentation Library
- MRNet 5.0 - Tree-based Overlay Network
- OMPT/OMPD - Tool Interfaces for OpenMP
Bottleneck Detection / Analysis
Performance Visualization
- Boxfish - Visual performance analysis through data centric mappings
- Ravel - MPI trace visualization using logical timelines
- MemAxes/Mitos - Visualization of on-node memory traffic

