"Reliable High Performance Peta- and Exa-Scale Computing," Gregory Bronevetsky, Lawrence Livermore National Laboratory
From Modelado Foundation
Overview
The focus of my project is to develop techniques to improve the productivity of scientific developers by developing tools that (i) help them understand how their applications behave so that (ii) they can use this knowledge to improve their applications’ accuracy and/or efficiency. I am pursuing a comprehensive approach to achieving this that considers both application software and the hardware on which it runs, and includes both static and dynamic analysis techniques. The techniques I am developing are being applied to a wide range of application analysis and optimization tasks, and my key deliverables focus on understanding application vulnerability to errors and helping developers to improve application resilience.
There are two primary approaches to understanding application behavior: static and dynamic analysis. In static analysis an application's source code is examined to compute an approximation the set of all the application's possible executions. Although very powerful, the approximations that static analysis is capable of computing are often very coarse and further, it is works poorly for characterizing floating point computations and application performance properties. Dynamic analysis is an alternative approach where the application is executed one or more times as its inputs and/or hardware mapping are varied. The data collected during these runs is modeled using statistical techniques such as regression (e.g., linear predictors), classification (e.g., support vector machines) or clustering (e.g. k-means). These models cannot be used to rigorously prove bounds on possible application behaviors but are very useful for accurately characterizing the application's normal and abnormal behavior, including performance data as well as logical and numeric state. To make to comprehensively analyze the behavior of real applications we have pursued both types of analyses to develop the Sight dynamic analysis system and Fuse static analysis system, described below.
Sight: dynamic analysis of application behavior
We have developed the Sight system to track the dynamic behavior of applications, including both high-level application state and low-level hardware performance metrics. We have developed a wide range of tools on top of Sight that help developers understand the flow of individual executions, the interactions between different application modules and how the application uses hardware resources
A. Debug Logging
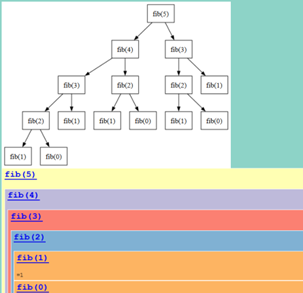
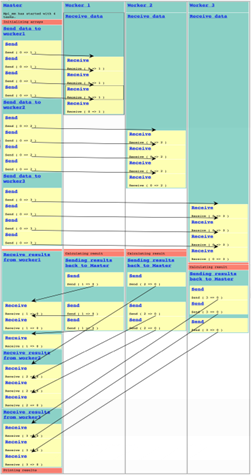
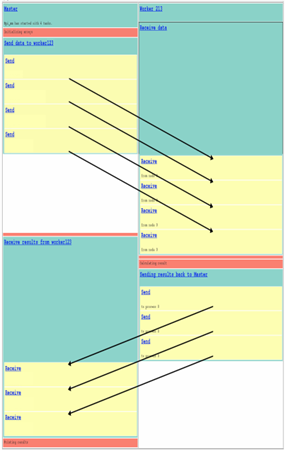
When a developer encounters a bug in their code or needs to understand its logical flow, they often add logging statements to various code regions that track where the application executes and its state at each execution point. For real applications these logs can become very long and difficult to understand. Further, for parallel applications logs from different threads and processes are difficult to relate to each other, making it very challenging to draw actionable insight from them. The Sight library provides developers with a simple API to document the logical flow of their programs and automatically generates an easy-to-understand visualization of this flow. This includes features for text indentation, structured log organization and simple navigation of large logs. Further, for parallel applications Sight makes it possible to view the logs from different threads, processes and tasks together, showing events, and communications in correct happens-before order. Sight currently supports applications parallelized with MPI, pthreads, the Open Community Runtime (OCR) and Containment Domains (CD).
Figure 1: Log of sequential application
Figure 2: Log of MPI master-worker application
Figure 3: Aggregated log of master-worker application where logs of all workers are merged
B. Cross-abstraction application analysis
To design accurate and efficient applications it is necessary to coordinate the operation of different application modules to ensure that the hardware resources used and accuracy levels produced by each module are compatible with those of other modules. For example, a memory-intensive task can run concurrently with a CPU-intensive task with no loss in efficiency while multiple memory-intensive tasks will destructively interfere with each other. Similarly, the accuracy in the output of a simulation depends on the choice of discretization it uses and the tolerance settings of its linear solver, which should be selected in concert to minimize the cost of achieving a solution with a given accuracy. While in the past this task was very challenging for developers because they had little tool support to track and relate the properties of different application modules, Sight provides extensive support for (i) tracking application logic and performance data and (ii) applying various visualization and statistical analyses to this data. The following sub-sections provide use-cases of applying Sight to study various aspects of application behavior.
1. Performance
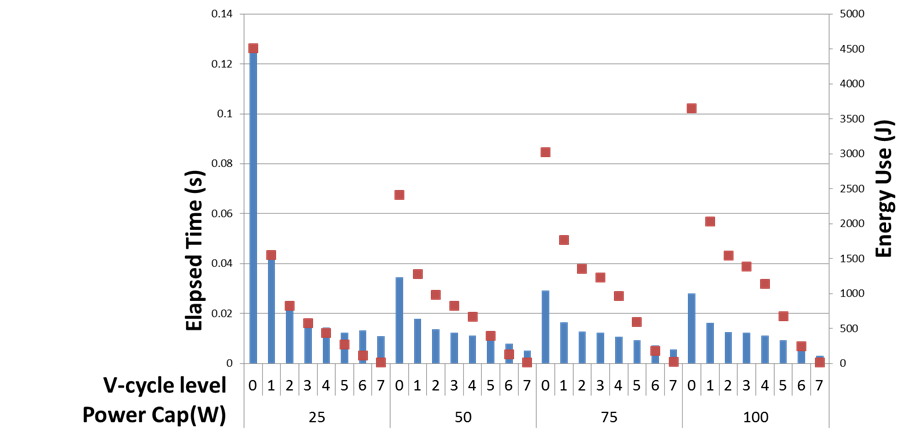
This use-case focuses on the AMG2013 [1] benchmark, which uses either the PCG or GMRES linear solver in concert with the AMG or diagonal preconditioner. Figure 4 shows execution time (blue bars, left axis) and energy (red squares, right axis) of the Coarsen phase of AMG within the GMRES solver on the default problem as a function of the level and the cap on processor power use (Intel Xeon E5-2670 processors). This phase computes a coarser problem from a finer one. Sparser problems (smaller level values) take up most of AMG’s execution time and are not significantly slowed by running at 50W rather than 100W. However, placing a 25W power cap significantly slows them down. In contrast, denser problems are significantly slowed by power capping but account for little of AMG’s overall time. The energy use of the Coarsen phase is therefore is minimized at 50W, where these two phenomena are balanced. This also holds for the full benchmark.
Figure 4: Performance and Energy use of the AMG Coarsen phase at different V-cycle levels and power caps
2. Accuracy
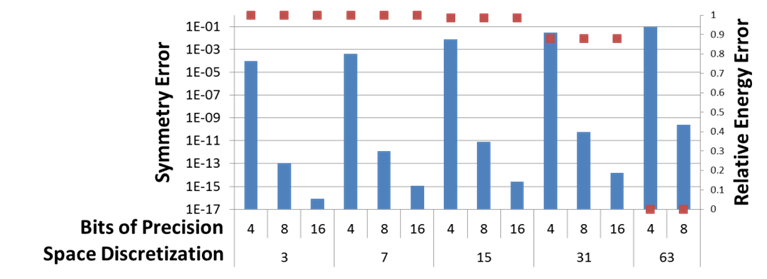
The next use-case focuses on the Lulesh [2] shock hydrodynamic benchmark. Lulesh simulates a spherical explosion and can be parameterized to use different memory layouts (array-of-structs or structs-of-arrays), floating point numbers with different precisions (float, double and long double) and spatial discretizations (number of mesh cells in each dimension). We used Sight to measure the influence of these Lulesh configuration options on the accuracy of its results (in addition to performance studies not detailed here). Figure 5 shows two different result error metrics as a function of Lulesh numerical precision and spatial discretization (3, 7, 15, 31 and 63 points). First, since the system simulated by Lulesh must be spherically symmetrical, we measured the error in symmetry as the total difference between all spherically opposite mesh points (blue bars, left axis). Second, we compared the total energy in the simulated system to that computed by Lulesh at the maximum numerical precision and the finest spatial discretization (red squares, right axis). The data shows that the two error metrics behave very differently. Symmetry error grows significantly worse with less precise numbers and somewhat worse with finer spatial discretizations. The latter is most likely due to the fact that finer spatial discretizations use smaller time steps. This results in simulations that run for more time steps and thus accumulate more asymmetry. In contrast, energy error is insensitive to numerical precision and grows worse with coarser spatial discretizations. This result indicates that developers must pay close attention to the error metric that is most meaningful to their end-users and optimize with respect to it. Further, since the performance and energy cost of these configurations are very different this analysis makes it possible to tune the cost of the computation to the value of its results to the user.
Figure 5: Errors in symmetry and energy in Lulesh output as a function of its numerical precision and spatial discretization
3. Resilience
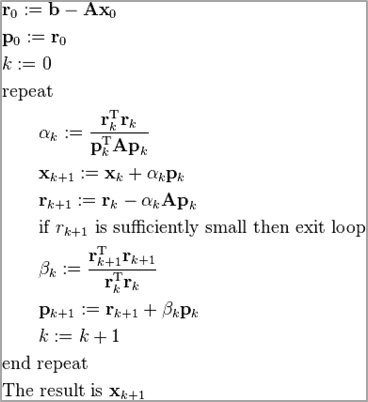
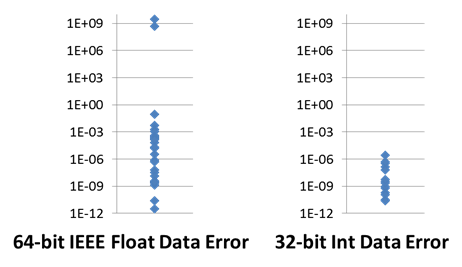
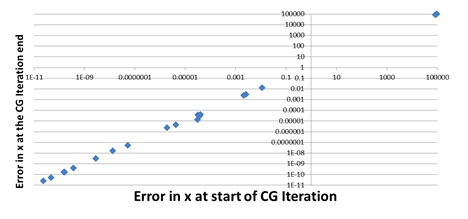
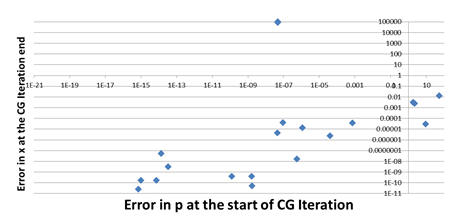
The final use-case focuses on quantifying the impact of transient (soft) errors in hardware on the correctness of application state, focusing on the miniFE[3] benchmark. MiniFE represents implicit finite-element simulations and its key workload is an implicit solve that uses the CG linear solver, which is summarized in Figure 6. Figure 7 shows the distribution of errors in the CG vector x (error is the L2 norm of the difference between the correct and incorrect versions of the vector) at the end of a CG iteration when an error is injected into two types of instructions during the iteration. The data shows that injections into 64-bit IEEE Float data have a significantly worse impact than 32-bit Int data. Figures 8 and 9 focus on how errors injected in one iteration of the CG algorithm propagate through subsequent iterations. They plot on the vertical axis the error in vector x at the end of an iteration and on the horizontal axis the error in either vector x (Figure 8) or p (Figure 9). The data shows that error in x at iteration end are strongly correlated to errors in x at iteration start and more weakly correlated with errors in p. This quantifies the way in which errors propagate through the logic of CG, which can help developers design resilience mechanisms for this algorithm.
Figure 6: CG Algorithm
Figure 7: Distribution of L2 errors in vector x at the end of CG time steps due to different types of injected errors
Figure 8: Propagation of errors from x at the start of an iteration to x at the end
Figure 9: Propagation of errors from p at the start of an iteration to x at the end
4. Performance prediction and modeling
The way in which applications utilize hardware can be very complex. Today’s tools can report a wide range of low-level metrics (e.g., cache miss rates, power draw) that document this utilization at a very low level. However, this information is not sufficient f or most optimization tasks since it is too low-level for most developers to reason about, while also being too application-agnostic for making even simple predictions of how a given set of tasks will perform on a given hardware system. To address this we developed a new performance analysis methodology that quantifies the application utilization of hardware from a software-centric perspective. Our approach is to measure for each application task the relationship between its performance and its use of hardware resources and then use this information to predict the execution time of any set of analyzed tasks as they concurrently utilize the same hardware. It works in two steps:
• Compression: quantifies the impact of hardware resource availability on task performance. It runs different resource-intensive micro-benchmarks concurrently with the task to reduce its available resources and observes how much the tasks slow as a result.
• Impact: quantifies how much a task’s execution reduces the hardware resources available to other tasks. It runs small micro-benchmarks that use few system resources concurrently with the task and measures how much the micro-benchmarks slow down.
We have demonstrated that this methodology can accurately quantify application utilization of the memory hierarchy and individual network switches and have shown how to predict the execution time of individual analyzed tasks on new hardware and multiple tasks that concurrently utilize the same hardware (e.g., a compute node or a network switch).
Fuse: static analysis of application behavior
Static analysis is an invaluable tool for comprehensive understanding of application behavior because it can formally prove many properties about an application’s set of possible behaviors. It is most useful for showing that certain code transformations are legal (e.g., that two code regions can run in parallel because their memory accesses don’t conflict) or proving the absence of various types of bugs (e.g., dereferencing null pointers). However, a key issue in the design of such analyses is that real applications are extremely complex and require many different analyses to disambiguate various different aspects of their behavior (e.g., pointer aliasing or targets of virtual function calls). While many such analyses have been developed and implemented over the past several decades, in practice they are largely ineffective because of the difficulty of enabling different analyses to interact with each other. Given any two analyses it is easy to modify each one to utilize the API provided by the other to obtain useful information. However, when tens of analyses are combined, the number of such interactions grows quadratically. The infeasibility of implementing all possible interactions severely limits the utility of the resulting static analysis systems. To enable static analyses that can robustly analyze large applications we developed the Fuse static analysis system on top of the ROSE source-to-source compiler. Fuse uses a novel universal representation of the results of static analyses, enabling any analysis to use the results of any other analysis without knowing which analysis produced the information, its semantics or any special-purpose API. The key idea of this approach is to allow each analysis to query any other analysis for the set of values, memory locations or code locations denoted by some source code expression. Fuse forwards the query to one or more other concurrently-running analyses and returns an object that implements the resulting set to the client analysis that performed the query. Although the internal implementation of this set object is opaque (e.g., it may denote the set of all even numbers or all values less than x), all set objects implement standard set operations such as equality, overlap, subset and enumeration (for finite sets). This makes it possible to transparently combine any number of analyses in many ways, such as:
• run one analysis after another,
• run several analyses independently and then intersect their results,
• run several analyses in lock-step, propagating the intermediate results of each one to the others
• combine traditional dense and more scalable SSA analyses,
• combine high-level ROSE analyses with low-level LLVM analyses, and
• combine analyses that model different aspects of application behavior (e.g, sequential, parallel or file I/O) or target different domain-specific languages (DSLs) embedded in the host language. We have developed and combined the following analyses within the Fuse framework:
• Constant Propagation – identifies variables that have the same value in all application executions,
• Points-to – detects the set of memory locations each pointer may point to,
• Dead-path elimination – finds the control flow paths that can never be reached in valid application executions and eliminates them from being considered by other analyses,
• Call-context sensitivity – improves the precision of other analyses by enabling each function to be analyzed separately based on where in the code it was called,
• MPI analysis – independently analyzes each MPI rank to identify which send and receive operations may match and enables other analyses to address MPI programs, and
• Value numbering – determines whether different sub-expressions must equal each other based on their structural similarity.
References
[1] AMG2013, https://asc.llnl.gov/CORAL-benchmarks/#amg2013
[2] I. Karlin, J. Keasler, R. Neely. LULESH 2.0 Updates and Changes. August 2013.
[3] Mantevo benchmarks, http://mantevo.org/
